Utah’s 50
Top Cities for Fit Lifestyles
2020
Utah has been ranked as one of the country’s healthiest states for its fitness lifestyle, health care access, and environmental wellness. Fitness enthusiasts will love hiking the five national parks and 45 state parks, skiing the mountains near Salt Lake City, and exploring the red rock canyons. Utah’s stunning natural recreations combine with an active community to create a welcoming environment for fitness regimes, organic food, and mindfulness habits.
Interesting things to know about Utah:
- Utah’s snowfall is drier than other states in the region, making it perfect for deep-powder skiing.
- Every county in Utah contains some part of a national forest filled with recreation opportunities.
- Utah was the host of the 2002 Winter Olympics.
The percentage of adults who report excessive drinking. Heavy drinking is linked to higher blood pressure, poorer liver function, increased stroke risk and larger waistlines.
The percentage of adults who report lack of physical activity.
The percentage of adults who report a BMI — or body mass index — above 30%. Higher BMI may be an indicator of greater risk to physical health.

Let Everyone Know Your City Made the List!
<a href="https://barbend.com/fit-cities-utah/" target="_blank" title="Best Cities for Fit Lifestyles in Utah"><img src="https://barbend.com/wp-content/plugins/bbstudy/images/badges/state/FitCity_Utah.svg" /></a>
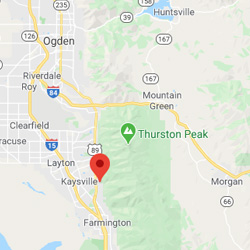
Fruit Heights, UT
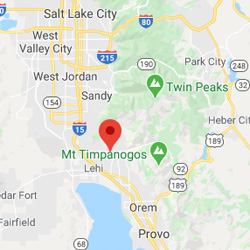
Highland, UT
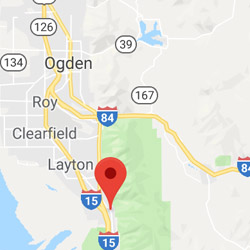
Farmington, UT
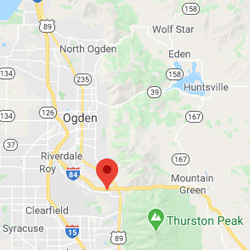
South Weber, UT
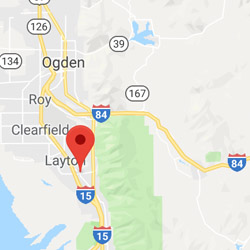
Kaysville, UT
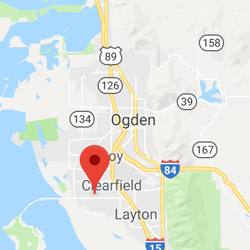
Syracuse, UT
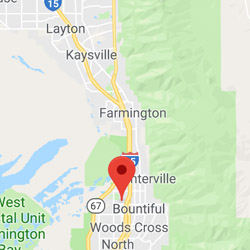
West Bountiful, UT
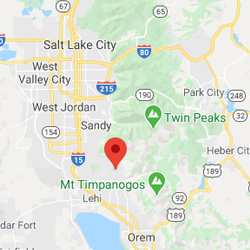
Alpine, UT
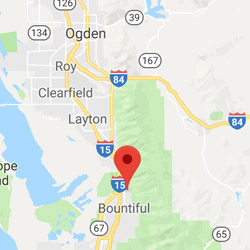
Centerville, UT
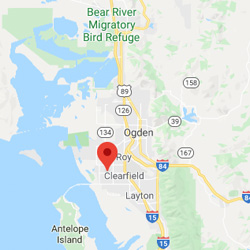
West Point, UT
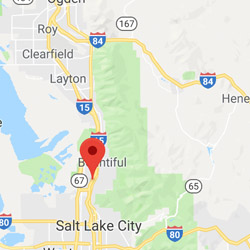
North Salt Lake, UT
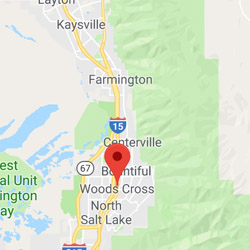
Woods Cross, UT
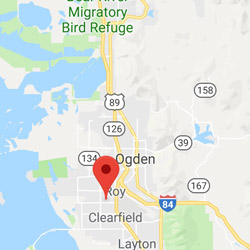
Clinton, UT
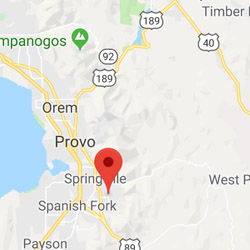
Mapleton, UT
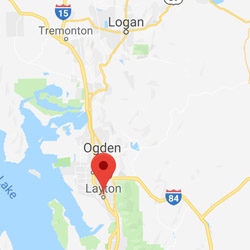
Layton, UT
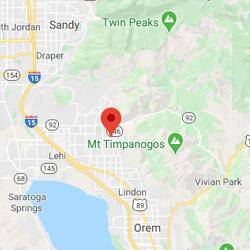
Cedar Hills, UT
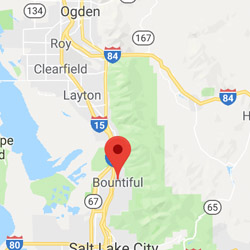
Bountiful, UT
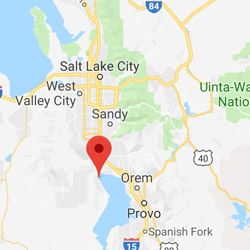
Saratoga Springs, UT
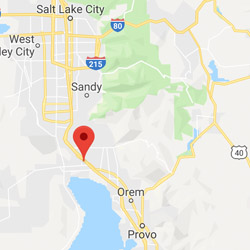
Lehi, UT
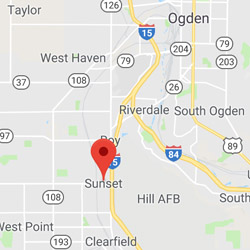
Sunset, UT
Salem, UT
Lindon, UT
Vineyard, UT
Clearfield, UT
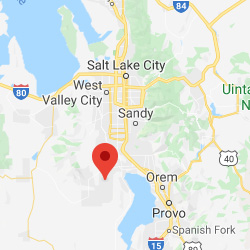
Eagle Mountain, UT
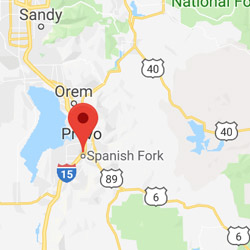
Spanish Fork, UT
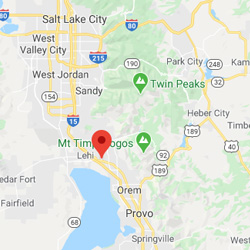
American Fork, UT
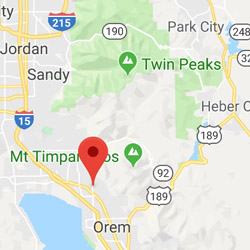
Pleasant Grove, UT
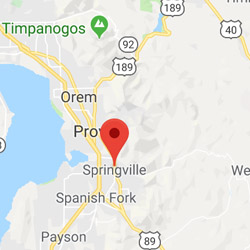
Springville, UT
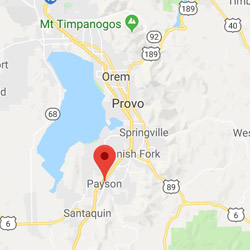
Payson, UT
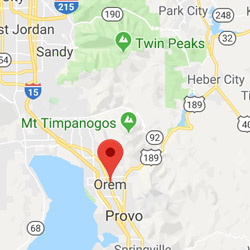
Orem, UT
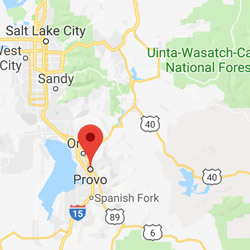
Provo, UT
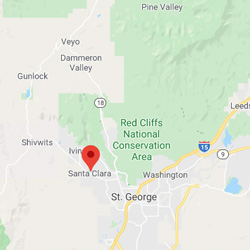
Santa Clara, UT
Ivins, UT
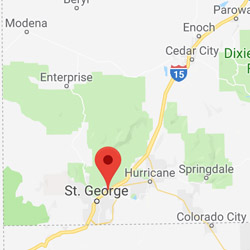
Washington, UT
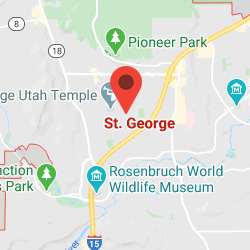
St. George, UT
Perry, UT
Hurricane, UT
Nibley, UT
Providence, UT
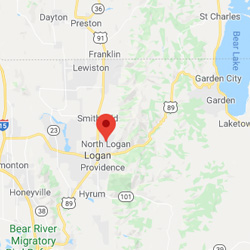
North Logan, UT
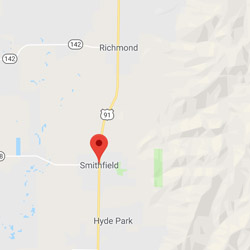
Smithfield, UT
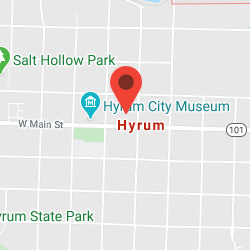
Hyrum, UT
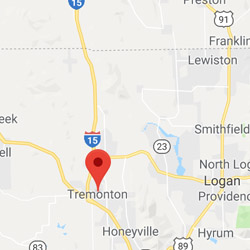
Tremonton, UT
Brigham City, UT
Moab, UT
Logan, UT
Enoch, UT
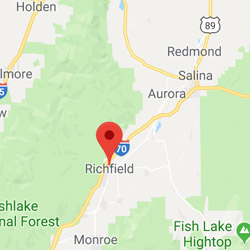
Richfield, UT
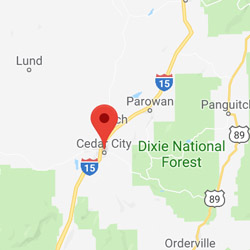
Cedar City, UT
Didn’t Find Your City in the Top 50?
| Rank | City | Population | Exercise Opportunities | Physical Inactivity | Healthy Food Access | Obesity | Air Pollution (PM2.5) | Smoking | Drinking | Physical Distress | Fit Score |
| 51 | Santaquin | 12274 | 690 | 180 | 150 | 300 | 2 | 110 | 120 | 3.7 | 86.62 |
| 52 | Ephraim | 7292 | 650 | 190 | 40 | 290 | 1.89 | 110 | 110 | 4 | 86.51 |
| 53 | Summit Park | 7954 | 950 | 110 | 50 | 150 | 2.38 | 80 | 170 | 2.9 | 86.51 |
| 54 | Nephi | 6111 | 690 | 180 | 150 | 300 | 2 | 110 | 120 | 3.7 | 86.14 |
| 55 | Stansbury Park | 9446 | 890 | 200 | 100 | 320 | 2.38 | 120 | 140 | 3.7 | 85.97 |
| 56 | Park City | 8504 | 950 | 110 | 50 | 150 | 2.38 | 80 | 170 | 2.9 | 85.93 |
| 57 | Snyderville | 6271 | 950 | 110 | 50 | 150 | 2.38 | 80 | 170 | 2.9 | 85.78 |
| 58 | Grantsville | 11568 | 890 | 200 | 100 | 320 | 2.38 | 120 | 140 | 3.7 | 85.18 |
| 59 | Tooele | 35251 | 890 | 200 | 100 | 320 | 2.38 | 120 | 140 | 3.7 | 84.88 |
| 60 | Roosevelt | 7070 | 530 | 210 | 70 | 290 | 2.17 | 100 | 120 | 3.5 | 84.77 |
| 61 | Draper | 48319 | 910 | 160 | 30 | 250 | 2.94 | 90 | 160 | 3.3 | 84.72 |
| 62 | Bluffdale | 14699 | 910 | 160 | 30 | 250 | 2.94 | 90 | 160 | 3.3 | 84.54 |
| 63 | South Jordan | 74149 | 910 | 160 | 30 | 250 | 2.94 | 90 | 160 | 3.3 | 84.33 |
| 64 | Price | 8232 | 780 | 230 | 110 | 250 | 2 | 110 | 130 | 3.6 | 84.24 |
| 65 | Midway | 5257 | 690 | 140 | 10 | 220 | 2.17 | 90 | 150 | 3.2 | 84.15 |
| 66 | Herriman | 44877 | 910 | 160 | 30 | 250 | 2.94 | 90 | 160 | 3.3 | 84.14 |
| 67 | Riverton | 44419 | 910 | 160 | 30 | 250 | 2.94 | 90 | 160 | 3.3 | 84.04 |
| 68 | Sandy | 96901 | 910 | 160 | 30 | 250 | 2.94 | 90 | 160 | 3.3 | 83.85 |
| 69 | Cottonwood Heights | 34117 | 910 | 160 | 30 | 250 | 2.94 | 90 | 160 | 3.3 | 83.82 |
| 70 | Heber | 16400 | 690 | 140 | 10 | 220 | 2.17 | 90 | 150 | 3.2 | 83.73 |
| 71 | Hooper | 8938 | 860 | 190 | 60 | 310 | 2.8 | 100 | 150 | 3.8 | 83.71 |
| 72 | Holladay | 30697 | 910 | 160 | 30 | 250 | 2.94 | 90 | 160 | 3.3 | 83.64 |
| 73 | Pleasant View | 10734 | 860 | 190 | 60 | 310 | 2.8 | 100 | 150 | 3.8 | 83.5 |
| 74 | Farr West | 7206 | 860 | 190 | 60 | 310 | 2.8 | 100 | 150 | 3.8 | 83.47 |
| 75 | West Jordan | 116046 | 910 | 160 | 30 | 250 | 2.94 | 90 | 160 | 3.3 | 83.3 |
| 76 | Plain City | 7120 | 860 | 190 | 60 | 310 | 2.8 | 100 | 150 | 3.8 | 83.29 |
| 77 | North Ogden | 20009 | 860 | 190 | 60 | 310 | 2.8 | 100 | 150 | 3.8 | 83.05 |
| 78 | Millcreek | 61270 | 910 | 160 | 30 | 250 | 2.94 | 90 | 160 | 3.3 | 82.92 |
| 79 | West Haven | 15239 | 860 | 190 | 60 | 310 | 2.8 | 100 | 150 | 3.8 | 82.86 |
| 80 | West Valley City | 136401 | 910 | 160 | 30 | 250 | 2.94 | 90 | 160 | 3.3 | 82.85 |
| 81 | Taylorsville | 60192 | 910 | 160 | 30 | 250 | 2.94 | 90 | 160 | 3.3 | 82.85 |
| 82 | White City | 5270 | 910 | 160 | 30 | 250 | 2.94 | 90 | 160 | 3.3 | 82.84 |
| 83 | Kearns | 37194 | 910 | 160 | 30 | 250 | 2.94 | 90 | 160 | 3.3 | 82.83 |
| 84 | Magna | 28257 | 910 | 160 | 30 | 250 | 2.94 | 90 | 160 | 3.3 | 82.78 |
| 85 | Murray | 49308 | 910 | 160 | 30 | 250 | 2.94 | 90 | 160 | 3.3 | 82.76 |
| 86 | Harrisville | 6696 | 860 | 190 | 60 | 310 | 2.8 | 100 | 150 | 3.8 | 82.75 |
| 87 | Midvale | 33636 | 910 | 160 | 30 | 250 | 2.94 | 90 | 160 | 3.3 | 82.64 |
| 88 | Salt Lake City | 200591 | 910 | 160 | 30 | 250 | 2.94 | 90 | 160 | 3.3 | 82.63 |
| 89 | Roy | 38773 | 860 | 190 | 60 | 310 | 2.8 | 100 | 150 | 3.8 | 82.59 |
| 90 | South Ogden | 17146 | 860 | 190 | 60 | 310 | 2.8 | 100 | 150 | 3.8 | 82.46 |
| 91 | Riverdale | 8785 | 860 | 190 | 60 | 310 | 2.8 | 100 | 150 | 3.8 | 82.18 |
| 92 | South Salt Lake | 25365 | 910 | 160 | 30 | 250 | 2.94 | 90 | 160 | 3.3 | 82.16 |
| 93 | Washington Terrace | 9187 | 860 | 190 | 60 | 310 | 2.8 | 100 | 150 | 3.8 | 82.09 |
| 94 | Vernal | 10370 | 620 | 220 | 70 | 320 | 2.28 | 120 | 140 | 4 | 81.82 |
| 95 | Ogden | 87325 | 860 | 190 | 60 | 310 | 2.8 | 100 | 150 | 3.8 | 81.73 |
How Did We Determine the Top Cities for Fit Lifestyles?
We compiled our list of Best Cities for for Fit Lifestyle by looking at 11 key metrics backed by scientific research. Keep reading to find out which metrics we chose and how they affect slumber.