

1
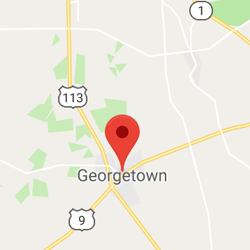
Georgetown
Fit Score: 79.63
 7,427
730
280
50
320
3.22
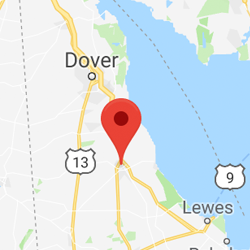
180
10
3.3
Yes
150
11
7,427
730
280
50
320
3.22
180
10
3.3
Yes
150
11
Georgetown, DE
2
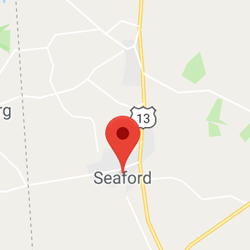
Seaford
Fit Score: 79.54
7,861
730
280
50
320
3.22
180
10
3.3
Yes
150
11
Seaford, DE
3
North Star
Fit Score: 79.38
7,390
970
230
50
290
3.5
170
10
3.3
Yes
190
11
North Star, DE
4
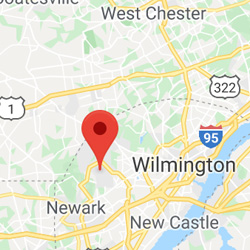
Hockessin
Fit Score: 78.71
13,672
970
230
50
290
3.5
170
10
3.3
Yes
190
11
Hockessin, DE
5
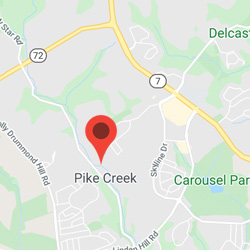
Pike Creek
Fit Score: 78.68
8,740
970
230
50
290
3.5
170
10
3.3
Yes
190
11
Pike Creek, DE
6
Glasgow
Fit Score: 77.46
15,280
970
230
50
290
3.5
170
10
3.3
Yes
190
11
Glasgow, DE
7
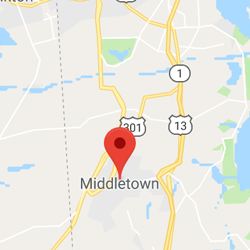
Middletown
Fit Score: 77.36
22,582
970
230
50
290
3.5
170
10
3.3
Yes
190
11
Middletown, DE
8
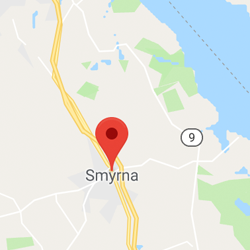
Smyrna
Fit Score: 77.35
11,580
600
300
40
340
3.26
180
11
3.5
No
160
12
Smyrna, DE
9
Milford
Fit Score: 77.27
11,353
600
300
40
340
3.26
180
11
3.5
No
160
12
Milford, DE
10
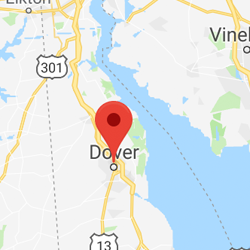
Dover
Fit Score: 77.16
38,079
600
300
40
340
3.26
180
11
3.5
No
160
12
Dover, DE
11
Pike Creek .
Fit Score: 76.81
10,823
970
230
50
290
3.5
170
10
3.3
Yes
190
11
Pike Creek Valley, DE
12
Bear
Fit Score: 76.76
20,401
970
230
50
290
3.5
170
10
3.3
Yes
190
11
Bear, DE
13
Edgemoor
Fit Score: 76.36
6,178
970
230
50
290
3.5
170
10
3.3
Yes
190
11
Edgemoor, DE
14
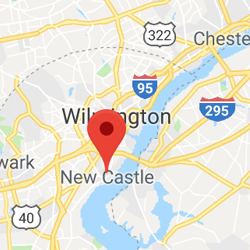
New Castle
Fit Score: 76.34
5,529
970
230
50
290
3.5
170
10
3.3
Yes
190
11
New Castle, DE
15
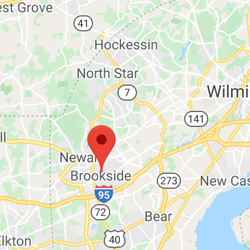
Brookside
Fit Score: 76.27
13,554
970
230
50
290
3.5
170
10
3.3
Yes
190
11
Brookside, DE
16

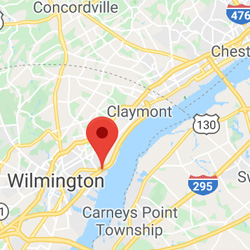
Wilmington .
Fit Score: 76.19
7,608
970
230
50
290
3.5
170
10
3.3
Yes
190
11
Wilmington Manor, DE
17
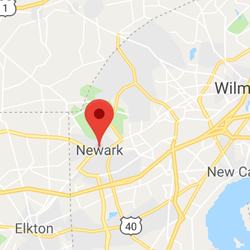
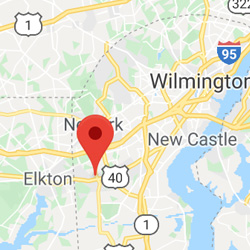
Newark
Fit Score: 76.15
33,673
970
230
50
290
3.5
170
10
3.3
Yes
190
11
Newark, DE
18
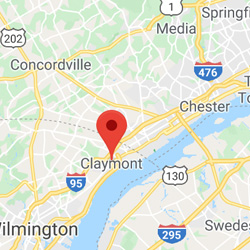
Claymont
Fit Score: 76.06
8,707
970
230
50
290
3.5
170
10
3.3
Yes
190
11
Claymont, DE
19
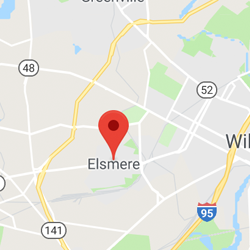
Elsmere
Fit Score: 75.81
5,981
970
230
50
290
3.5
170
10
3.3
Yes
190
11
Elsmere, DE
20
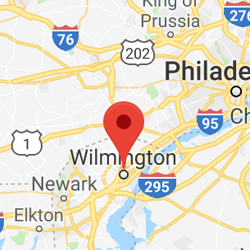
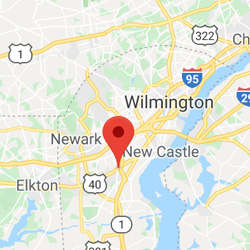
Wilmington
Fit Score: 75.61
70,635
970
230
50
290
3.5
170
10
3.3
Yes
190
11