Kansas’s 50
Top Cities for Fit Lifestyles
2020
As the United States’ most productive agricultural state, Kansas welcomes health conscious individuals to enjoy a flourishing and fertile environment. Kansas creates a unique focus on health through nutrition, and one can find many farm-to-table restaurants and organic farmer’s markets throughout the state. With a humid and warm climate, Kansas welcomes year-round outside activity. Hills, major rivers, and forests cover the land and build optimal recreational fitness sites, including runs, swims, and active exploration.
Interesting things to know about Kansas:
- Kansas is a major producer of sunflowers
- Kansas grows more wheat than any other state in the U.S.
- Farmland covers 88% of the state.
The percentage of adults who report excessive drinking. Heavy drinking is linked to higher blood pressure, poorer liver function, increased stroke risk and larger waistlines.
The percentage of adults who report lack of physical activity.
The percentage of adults who report a BMI — or body mass index — above 30%. Higher BMI may be an indicator of greater risk to physical health.

Let Everyone Know Your City Made the List!
<a href="https://barbend.com/fit-cities-kansas/" target="_blank" title="Best Cities for Fit Lifestyles in Kansas"><img src="https://barbend.com/wp-content/plugins/bbstudy/images/badges/state/FitCity_Kansas.svg" /></a>
Newton, KS

Soldier, KS
Tecumseh, KS
Leawood, KS
Garden City, KS
Liberal, KS
Topeka, KS
McPherson, KS
Winfield, KS
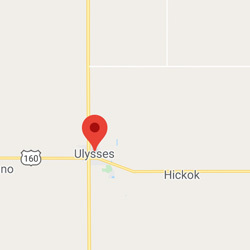
Ulysses, KS
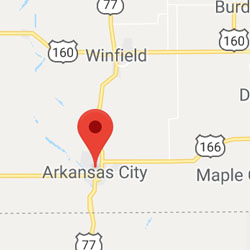
Arkansas City, KS
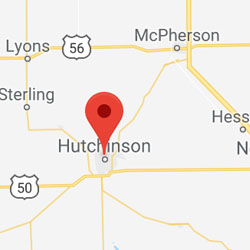
Hutchinson, KS
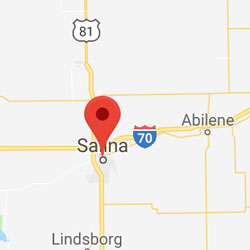
Salina, KS
Dodge City, KS
Bel Aire, KS
Grant, KS
Derby, KS
Rockford, KS
Attica, KS
Park, KS
Valley Center, KS
Mulvane, KS
Prairie Village, KS
Park City, KS
Gypsum, KS
Olathe, KS
Kansas City, KS
Shawnee, KS
Lenexa, KS
Salem, KS
Overland Park, KS
Haysville, KS

Gardner, KS

Riverside, KS
Wichita, KS
Spring Hill, KS
Chanute, KS
Roeland Park, KS
Iola, KS
Merriam, KS
Lansing, KS
Bonner Springs, KS
Mission, KS
Fairmount, KS
Great Bend, KS
De Soto, KS
Basehor, KS
Pratt, KS
Tonganoxie, KS
Paola, KS
Didn’t Find Your City in the Top 50?
| Rank | City | Population | Exercise Opportunities | Physical Inactivity | Healthy Food Access | Obesity | Air Pollution (PM2.5) | Smoking | Drinking | Physical Distress | Fit Score |
| 51 | Leavenworth | 36062 | 790 | 250 | 100 | 370 | 3.54 | 160 | 170 | 3.2 | 77.33 |
| 52 | Emporia | 24765 | 710 | 230 | 70 | 380 | 3.19 | 190 | 160 | 3.5 | 76.81 |
| 53 | Wellington | 7748 | 620 | 290 | 100 | 400 | 3.19 | 160 | 160 | 3.1 | 76.12 |
| 54 | Parsons | 9665 | 690 | 290 | 70 | 350 | 3.47 | 210 | 160 | 3.7 | 76.07 |
| 55 | Independence | 8598 | 750 | 320 | 100 | 400 | 3.54 | 190 | 160 | 3.6 | 75.71 |
| 56 | Andover | 13278 | 680 | 270 | 70 | 350 | 3.36 | 180 | 180 | 3.1 | 75.67 |
| 57 | Atchison | 10560 | 740 | 320 | 60 | 430 | 3.4 | 190 | 170 | 3.3 | 75.63 |
| 58 | Coffeyville | 9366 | 750 | 320 | 100 | 400 | 3.54 | 190 | 160 | 3.6 | 75.61 |
| 59 | Bruno | 15565 | 680 | 270 | 70 | 350 | 3.36 | 180 | 180 | 3.1 | 75.55 |
| 60 | Junction City | 22120 | 860 | 240 | 130 | 360 | 3.08 | 180 | 180 | 3.2 | 75.29 |
| 61 | Ottawa | 12267 | 560 | 260 | 180 | 340 | 3.29 | 200 | 160 | 3.2 | 75.19 |
| 62 | Hays | 20852 | 900 | 240 | 60 | 320 | 2.63 | 160 | 190 | 3.2 | 75.11 |
| 63 | Pleasant | 5157 | 680 | 270 | 70 | 350 | 3.36 | 180 | 180 | 3.1 | 75.09 |
| 64 | Smoky Hill | 6175 | 860 | 240 | 130 | 360 | 3.08 | 180 | 180 | 3.2 | 75.09 |
| 65 | Colby | 5317 | 790 | 300 | 110 | 350 | 2.31 | 150 | 180 | 2.9 | 75.04 |
| 66 | Pittsburg | 20178 | 790 | 260 | 140 | 330 | 3.4 | 190 | 170 | 3.5 | 75 |
| 67 | Fort Riley | 7808 | 860 | 240 | 130 | 360 | 3.08 | 180 | 180 | 3.2 | 74.93 |
| 68 | Abilene | 6300 | 470 | 280 | 30 | 340 | 3.08 | 170 | 170 | 2.9 | 74.56 |
| 69 | Augusta | 9342 | 680 | 270 | 70 | 350 | 3.36 | 180 | 180 | 3.1 | 74.27 |
| 70 | Fort Scott | 7765 | 430 | 300 | 80 | 360 | 3.33 | 200 | 160 | 3.6 | 74.24 |
| 71 | El Dorado | 12935 | 680 | 270 | 70 | 350 | 3.36 | 180 | 180 | 3.1 | 74.08 |
| 72 | Eudora | 6384 | 920 | 170 | 40 | 280 | 3.43 | 150 | 220 | 3.4 | 73.21 |
| 73 | Palmyra | 7386 | 920 | 170 | 40 | 280 | 3.43 | 150 | 220 | 3.4 | 73.21 |
| 74 | Manhattan | 54959 | 690 | 220 | 0 | 310 | 3.19 | 160 | 200 | 2.7 | 72.95 |
| 75 | Lawrence | 97286 | 920 | 170 | 40 | 280 | 3.43 | 150 | 220 | 3.4 | 72.35 |
| 76 | Madison | 9872 | 900 | 160 | 200 | 250 | 3.15 | 150 | 230 | 3.2 | 68.28 |
How Did We Determine the Top Cities for Fit Lifestyles?
We compiled our list of Best Cities for for Fit Lifestyle by looking at 11 key metrics backed by scientific research. Keep reading to find out which metrics we chose and how they affect slumber.