150 Top
Cities for Fit Lifestyles
Where you live can have a big impact on how you live. And that’s especially true for fitness-minded folks. Access to outdoor activities, air quality, proximity to gyms: These and numerous other factors help determine how we incorporate fitness into our daily lives. All of these can vary significantly from one city to the next.
States With The Highest Number of Top Cities for Fit Lifestyles

Utah
53 Cities

Maryland
42 Cities

California
29 Cities

Virginia
26 Cities
So, how does your city stack up? To find out, keep reading. We’ve created a comprehensive, state-by-state list of the 150 Top Cities for Fit Lifestyle in the United States. Check out our methodology for all the details about how we selected our data.
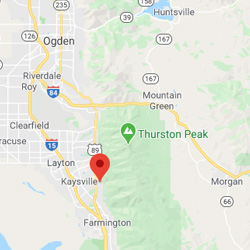
Fruit Heights, UT

Highland, UT

Farmington, UT

Travilah, MD
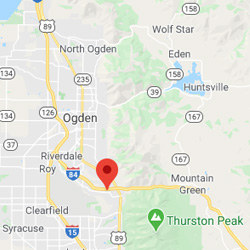
South Weber, UT

Kaysville, UT
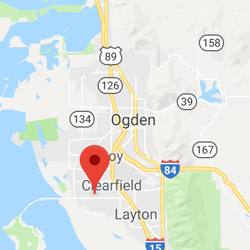
Syracuse, UT
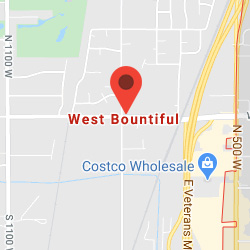
West Bountiful, UT

Alpine, UT
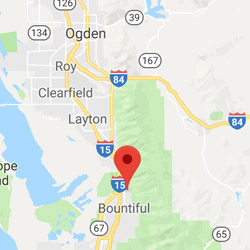
Centerville, UT

West Point, UT
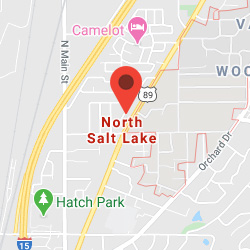
North Salt Lake, UT
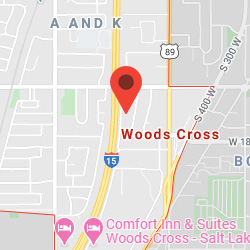
Woods Cross, UT

Clinton, UT

Mapleton, UT

Layton, UT

Cedar Hills, UT
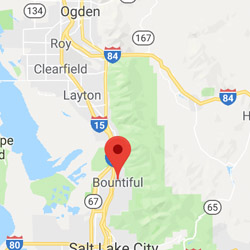
Bountiful, UT
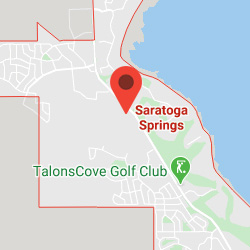
Saratoga Springs, UT

Darnestown, MD

Lehi, UT

Potomac, MD
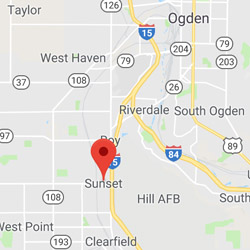
Sunset, UT

Salem, UT

Lindon, UT

Vineyard, UT

Clearfield, UT

Eagle Mountain, UT
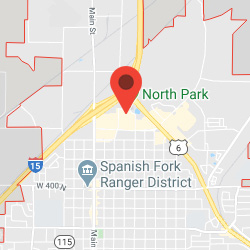
Spanish Fork, UT

American Fork, UT

Pleasant Grove, UT

Los Altos Hills, CA

Springville, UT

Payson, UT

North Potomac, MD

Orem, UT
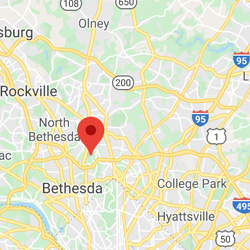
South Kensington, MD

Bethesda, MD

Poolesville, MD

Provo, UT
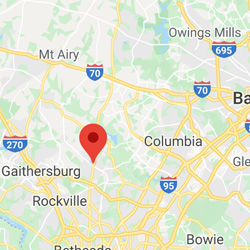
Olney, MD

Clarksburg, MD
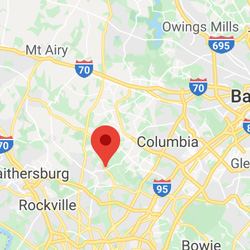
Ashton-Sandy Spring, MD

Santa Clara, UT

Los Altos, CA
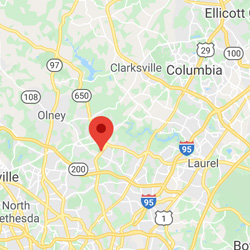
Cloverly, MD
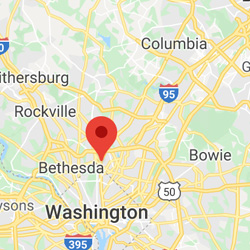
Four Corners, MD
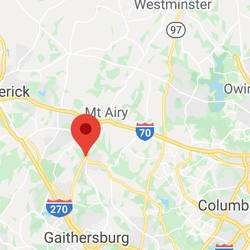
Damascus, MD

Woodside, CA

Atherton, CA
Our Methodology
Methodology
If you’ve ever wondered if you live in a healthy city, then the following analysis of our methodology might speak to you. There are many factors that can influence the overall health of residents in a given city — we know because we’ve compiled a comprehensive list backed by peer reviewed scientific studies.
We determined the fittest cities by processing eleven weighted variables based on data collected by the Center for Disease Control and Prevention (CDC), U.S. Census Bureau and Country Health Rankings & Roadmaps (CHR). We assigned weights to the different variables relative to their impact on overall fitness levels as determined by our data team.
Here is a breakdown of the data for the variables we chose and their corresponding weights.
For each city, the ‘Fit Score’ is based on the combination of 11 data sets. To unify the data across different cities regardless of the population, we calculated the data sets per 1000 or per 30 days depending on the data set. For example, a large city such as New York City will have more drinking, obesity rate, etc. simply because it has a large population. However, each of these factors are not given equal consideration. Each factor listed is given a weight, with a weight of 10 contributing most to the city’s ‘Fit Score’.
Exercise Opportunity Access
Defined as the percentage of the population with access to places for physical activity (parks or recreational facilities), an individual’s environment plays a key role in determining their activity level.
Cities that have easier access to more opportunities for exercise are likely to be fitter than those with more difficult access to fewer opportunities. According to the CHR’s county health ranking model, “individuals who live closer to sidewalks, parks, and gyms are more likely to exercise.”
According to the American Heart Journal, “higher access to exercise opportunities correlated with lower cardiovascular disease mortality.” (1) The inverse was also true, that “counties with lower access to exercise facilities had higher prevalence of obesity and diabetes when compared with counties with higher access.”
From a public health point of view, access to exercise opportunity is integral for maintaining a healthy population as simply increasing physical activity alone is unlikely to “eliminate the risks of sedentary behavior”, according to the International Journal of Behavioral Nutrition and Physical Activity. (2)
We found the data in this category to be very compelling, which is why exercise opportunity access was not only included, but weighted heavily in our rankings. However, we would have liked to understand and see more data on households who report having home gyms, treadmills, or other opportunities for exercise in their residences and how that might affect a population’s exercise opportunity access.
Physical Inactivity
The science is clear that physically active individuals are more likely to be healthier than their inactive counterparts.
A study in volume 2 of Comprehensive Physiology from the American Physiological Society found “conclusive and overwhelming scientific evidence, largely ignored and prioritized as low, exists for physical inactivity as a primary and actual cause of most chronic diseases.” (3)
The study also found that in addition to those chronic diseases, an individual with a high frequency of physical inactivity is likely to die faster.
“Comprehensive evidence…clearly establishes that lack of physical activity affects almost every cell, organ, and system in the body causing sedentary dysfunction and accelerated death.”
For these reasons, this factor was heavily weighted in our analysis.
Limited Access to Healthy Food
Those who live neighborhoods with access to supermarkets that offer healthier foods, such as fresh produce, “tend to have healthier diets and lower levels of obesity”, according to a 2009 review in the American Journal of Preventive Medicine. (4)
To be clear, access to healthy food means the actual ability to obtain it, not its proximity to household food shoppers. In a 2015 study to determine healthy food access’ impact on urban residents’ diet and body mass index (BMI), Public Health Nutrition found that “physical distance from full-service supermarkets was unrelated to weight or dietary quality.” (5)
A significant aspect of fitness is proper nutrition, hence its impact in our ranking choices.
Obesity in Adults
Numerous large, long-term epidemiological studies have shown that obesity is strongly associated with an increased risk of type 2 diabetes, gallbladder disease, coronary heart disease (CHD), hypertension, osteoarthritis (OA), and high blood cholesterol. (6)
Obesity was formally recognized as a global health pandemic by a World Health Organization (WHO) consultation in 1997. “Overweight, obesity, and their impacts in different dimensions of health must be considered as one of the most important public health priorities.” (7)
Environment has shown to play a major role in rates of obesity. Developing countries and urban areas affected the most. In 2007, Epidemiologic Reviews concluded that “reversing the factors…that lead to increased caloric consumption and reduced physical activity would require major changes in urban planning, transportation, public safety, and food production and marketing.” (8)
Air Pollution Cities
Cities with poorer air quality put their populations at higher risk of acquiring adverse health effects incurred from the inhalation of that polluted air.
A 2018 study in the International Journal of Environmental Research and Public Health determined that “this augmentation in inhaled dose during exercise might trigger a rise in air pollution’s deleterious effects when exercise is performed in high polluted environments.” (9)
However, there is evidence to suggest that until a pollution concentration of particulate matter (PM) 2.5 of 100μg/m3 (micrograms per cubic meter) is reached, the benefits of exercise “outweigh health risks from air pollution” according to a 2016 study in Preventive Medicine. (10)
Smoking in Adults
There are many negative health effects associated with smoking, one of which may be a decrease in physical activity regardless of age. According to a 2009 study in the Official Journal of the Society for Research on Nicotine and Tobacco, “a consistent and negative relationship between physical activity and smoking emerged across both sex and age” and “those engaging in more intense activity were less likely to be heavy or light smokers.” (11)
A 2012 study in the Hellenic Journal of Cardiology also determined that “smoking was associated with significantly decreased odds of being either moderately or highly physically active.” (12)
Cities with easier access to opportunities for exercise and more physically active populations could better enable heavy smokers to quit. A 2019 study in The Journal of Nutrition, Health and Aging concluded that “…there is some evidence that physical activity and exercise may aid in smoking cessation.” (13)
Frequent Physical Distress
Stress, whether it be objective (i.e life events) or subjective (i.e. distress), “related to reduced physical activity” and “has a negative effect on physical activity” according to a review of 168 different studies in the Journal of Sports Medicine. “Stress impairs efforts to be physically active.” (14)
A 2019 cross-sectional study in the Journal of Sport and Health Science determined that “depression increases physical distress and health problems, ultimately impairing functional well-being and quality of life.” (15)
Poor Physical Health Days
In 2017, a study in Population Health Metrics determined “a strong negative correlation between prevalence of poor self-reported health and life expectancy” in counties that spanned across the United States, including South Dakota, eastern Kentucky, Western Virginia, the southern border of Texas, southern Mississippi, and Alabama between 2007 and 2012. (16)
Although it did specify the inclusion of any densely populated cities, it does give insight how perceived health can play a role in longevity.
For those in the workforce, a 2006 study in the British Journal of Sports Medicine concluded that those who undertook three days of vigorous activity per week took less sick days than those who did not. (17)
Drinking Water Violations
First off, it is worth noting that voluntary drinking conditions absent fear of dehydration (drinking fluid only when one wants to) has a positive effect on physical performance compared to those who drink in a dictated condition, e.g. drinking a set volume of water during training, according to a novel 2016 study in Biology of Sport. (18)
It is also well known the negative impacts that dehydration can have on physical performance, including perceived exertion and heart rate recovery. (19). For those curious, the optimum temperature for acquiring hydration after sweat inducing activity is 61°F/16°C as determined by The International Journal of Clinical and Experimental Medicine in 2013. (20)
So drinking water is important, but so is the quality of that water. In 2018, a study in the Proceedings of the National Academy of Sciences of the United States determined that over the past 34 years, upwards of 28% of the U.S. population lived in areas where the community water systems violated health-based water quality standards. (21)
Water contaminants “can cause immediate illness, such as the 16 million cases of acute gastroenteritis that occur each year at US community water systems.”
Excessive Drinking
Despite the negative effects that might be assumed regarding alcohol consumption and its relationship to physical activity, a 2010 study in The American Journal of Health Promotion actually found results for both men and women that “strongly suggest that alcohol consumption and physical activity [per week] are positively correlated. The association persists at heavy drinking levels.” (22)
For context, men and women were considered “heavy drinkers” if they consumed more than 76 and 46 alcoholic beverages, respectively, within 30 days prior to the study’s interview date.
However, the impacts of alcohol on exercise itself does lend to the negative effects many people are likely aware of. A review in the Journal of Sports Medicine cited that “alcohol continues to be the most frequently consumed drug among athletes and habitual exercisers” and that “alcohol use is directly linked to the rate of injury sustained in sport events and appears to evoke detrimental effects on exercise performance capacity.” (23).
The context in which alcohol is consumed matters and therefore played a role in our ranking choices.
Frequent Mental Distress
It should not come as a surprise that frequent mental distress has a negative impact on overall health. A 2016 study in the Journal of Preventive Medicine concluded a “high prevalence of mental distress and poor functional health in the US.” (24)
East-South-Central states (Alabama, Kentucky, Tennessee, Mississippi) had the highest prevalence of frequent mental distress — Tennessee being the worst — while West-North-Central states (Iowa, Kansas, Minnesota, Missouri, Nebraska, North Dakota, South Dakota) had the lowest — North Dakota was best on the list. “Females were more likely to report frequent mental distress in all states.”
References
- Suveen Angraal, et al. Association of Access to Exercise Opportunities and Cardiovascular Mortality. 2019. American Heart Journal. Jun;212:152-156. doi: 10.1016.
- Hidde P. van der Ploeg and Melvyn Hillsdon. Is sedentary behaviour just physical inactivity by another name? 2017. International Journal of Behavioral Nutrition and Physical Activity. doi: 10.1186/s12966-017-0601-0.
- Frank W. Booth, et al. Lack of exercise is a major cause of chronic diseases. 2012. Comprehensive Physiology. doi: 10.1002/cphy.c110025.
- Nicole I. Larson, Mary T. Story, Melissa C. Nelson Neighborhood Environments: Disparities in Access to Healthy Foods in the U.S. 2009. American Journal of Preventive Medicine. Jan;36(1):74-81. doi: 10.1016.
- Tamara Dubowitz, et al. Healthy Food Access for Urban Food Desert Residents: Examination of the Food Environment, Food Purchasing Practices, Diet and BMI, 2015. Public Health Nutrition. doi: 10.1017.
- Xavier Pi-Sunyer. The Medical Risks of Obesity. 2010. Human Health Services Postgraduate Medicine. doi: 10.3810/pgm.2009.11.2074.
- Shirin Djalalinia, et al. Health Impacts of Obesity. 2015. Pakistan Journal of Medical Sciences.10.12669/pjms.311.7033.
- Benjamin Caballero. The Global Epidemic of Obesity: An Overview. 2007. Epidemiologic Reviews. Volume 29, Issue 1, p.1–5.
- Leonardo Alves Pasqua, et al. Exercising in Air Pollution: The Cleanest versus Dirtiest Cities Challenge. 2018. International Journal of Environmental Research and Public Health. doi: 10.3390/ijerph15071502.
- Marko Tainio, et al. Can air pollution negate the health benefits of cycling and walking? 2016. Preventive Medicine. doi: 10.1016/j.ypmed.2016.02.002.
- Marianna Charilaou, et al. Relationship Between Physical Activity and Type of Smoking Behavior Among Adolescents and Young Adults in Cyprus. 2009. Official Journal of the Society for Research on Nicotine and Tobacco. doi. 10.1093/ntr/ntp096.
- George Papathanasiou, et al. Smoking and Physical Activity Interrelations in Health Science Students. Is Smoking Associated With Physical Inactivity in Young Adults? 2012. Hellenic Journal of Cardiology. Jan-Feb 2012;53(1):17-25.
- J.H. Swan, et al. Smoking predicting physical activity in an aging America. 2019. The Journal of Nutrition, Health and Aging. doi: 10.1007/s12603-017-0967-3.
- Matthew A. Stults-Kolehmainen and Rajita Sinha. The Effects of Stress on Physical Activity and Exercise. 2015. Journal of Sports Medicine. doi: 10.1007/s40279-013-0090-5.
- Anne-Marie Elbe, et al. Is regular physical activity a key to mental health? 2019. Journal of Sport and Health Science. doi: 10.1016/j.jshs.2018.11.005
- Laura Dwyer-Lindgren, et al. The Effects of Stress on Physical Activity and Exercise. 2017. Population Health Metrics. doi: 10.1186/s12963-017-0133-5.
- K I Proper, et al. Dose–response relation between physical activity and sick leave. 2006. British Journal of Sports Medicine. doi: 10.1136/bjsm.2005.022327.
- TP Backes and K Fitzgerald. Fluid consumption, exercise, and cognitive performance. 2016. Biology of Sport. doi: 10.5604/20831862.1208485.
- Justin A. Kraft, et al. Impact of Dehydration on a Full Body Resistance Exercise Protocol. 2010. European Journal of Applied Physiology. doi: 10.1007/s00421-009-1348-3.
- Abdollah Hosseinlou, et al. The effect of water temperature and voluntary drinking on the post rehydration sweating. 2013. The International Journal of Clinical and Experimental Medicine. 6(8): 683–687.
- Maura Allaire, et al. National trends in drinking water quality violations. 2018. Proceedings of the National Academy of Sciences of the United States. doi: 10.1073/pnas.1719805115.
- Michael T. French, et al. Do Alcohol Consumers Exercise More? Findings from a National Survey. 2010. The American Journal of Health Promotion. doi: 10.4278/ajhp.0801104.
- Mahmoud S El-Sayed, et al. Interaction Between Alcohol and Exercise: Physiological and Haematological Implications. 2005. Journal of Sports Medicine. doi: 10.1016/j.ypmed.2016.06.011.
- Raghid Charara, et al. Mental Distress and Functional Health in the United States. 2016. Journal of Preventive Medicine. doi: 10.1016/j.ypmed.2016.06.011.