

1
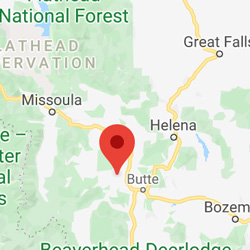
Anaconda
Fit Score: 75.73
 9,131
730
250
30
250
2.59
190
12
3.9
No
180
12
9,131
730
250
30
250
2.59
190
12
3.9
No
180
12
Anaconda, MT
2
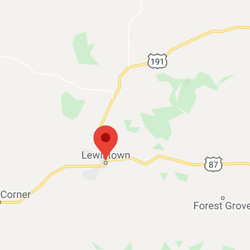
Lewistown
Fit Score: 74.24
5,818
720
210
110
270
1.68
160
11
3.5
No
190
11
Lewistown, MT
3
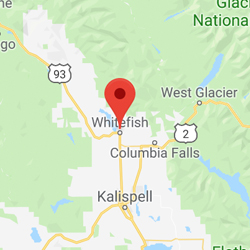
Whitefish
Fit Score: 73.16
7,870
820
190
40
220
3.12
170
11
3.4
No
210
11
Whitefish, MT
4
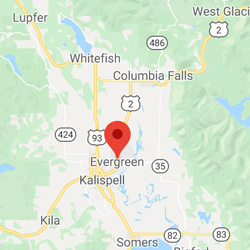
Evergreen
Fit Score: 73.09
7,552
820
190
40
220
3.12
170
11
3.4
No
210
11
Evergreen, MT
5
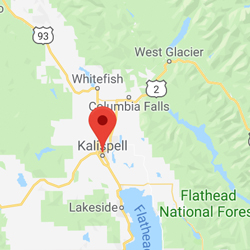
Kalispell
Fit Score: 72.98
23,938
820
190
40
220
3.12
170
11
3.4
No
210
11
Kalispell, MT
6
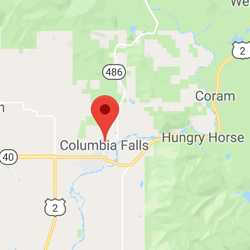
Columbia Fa.
Fit Score: 72.96
5,575
820
190
40
220
3.12
170
11
3.4
No
210
11
Columbia Falls, MT
7
Helena Vall.
Fit Score: 71.83
8,622
780
170
60
240
2.14
150
9
3
Yes
220
10
Helena Valley West Central, MT
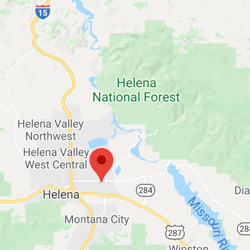
8
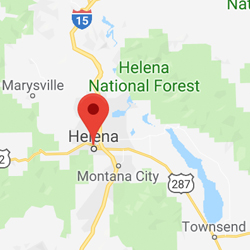
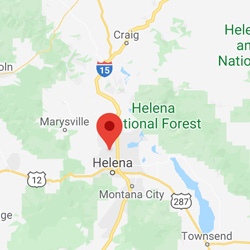
Helena
Fit Score: 71.11
32,315
780
170
60
240
2.14
150
9
3
Yes
220
10
Helena, MT
9
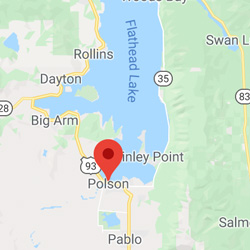
Polson
Fit Score: 71.04
5,018
540
210
30
290
3.08
190
14
4.5
No
190
14
Polson, MT
10
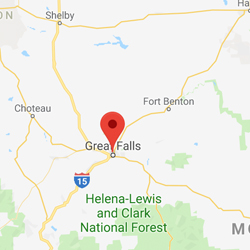
Great Falls
Fit Score: 71
58,701
830
210
90
270
2.03
180
11
3.7
Yes
210
11
Great Falls, MT
11
Helena Vall.
Fit Score: 70.92
7,517
780
170
60
240
2.14
150
9
3
Yes
220
10
Helena Valley Southeast, MT
12
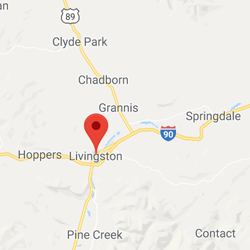
Livingston
Fit Score: 70.82
7,784
600
230
110
260
1.89
150
10
3.3
Yes
200
10
Livingston, MT
13
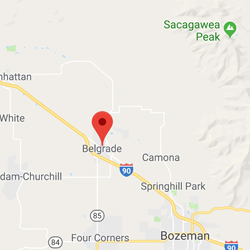
Belgrade
Fit Score: 70.57
8,993
810
120
30
160
2.49
150
9
3
No
240
10
Belgrade, MT
14
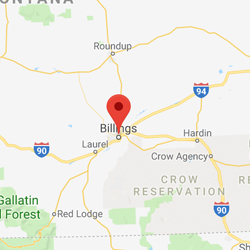
Billings
Fit Score: 70.42
109,550
840
210
70
270
2.21
160
10
3.4
Yes
220
11
Billings, MT
15
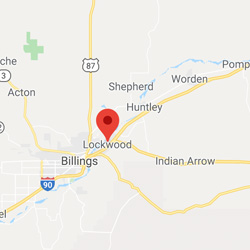
Lockwood
Fit Score: 70.42
7,503
840
210
70
270
2.21
160
10
3.4
Yes
220
11
Lockwood, MT
16
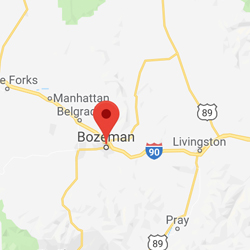
Bozeman
Fit Score: 70.26
48,532
810
120
30
160
2.49
150
9
3
No
240
10
Bozeman, MT
17
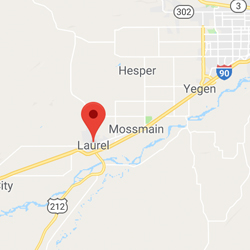
Laurel
Fit Score: 70.24
6,766
840
210
70
270
2.21
160
10
3.4
Yes
220
11
Laurel, MT
18
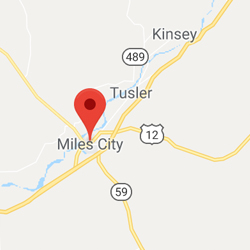
Miles City
Fit Score: 70.16
8,393
720
260
200
300
2
170
10
3.1
No
210
10
Miles City, MT
19
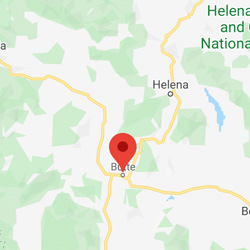
Butte
Fit Score: 69.06
34,993
630
210
40
260
2.8
180
11
3.7
No
220
11
Butte, MT
20
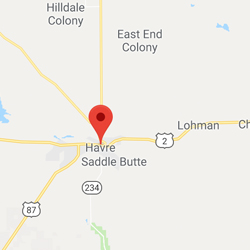
Havre
Fit Score: 68.58
9,715
770
250
190
360
2.14
200
12
4
No
210
13
Havre, MT
21
Orchard Hom.
Fit Score: 64.92
5,588
930
150
70
230
3.01
180
11
3.7
Yes
260
11
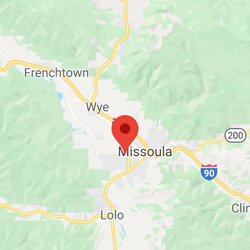
Orchard Homes, MT
22
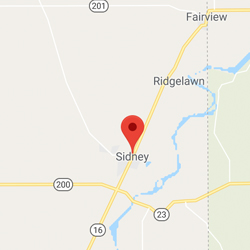
Sidney
Fit Score: 64.6
6,246
500
270
90
300
2.17
170
9
3.1
No
240
10
Sidney, MT
23
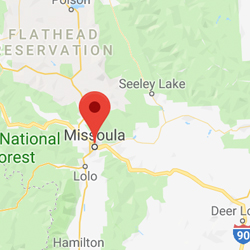
Missoula
Fit Score: 64.46
74,428
930
150
70
230
3.01
180
11
3.7
Yes
260
11