

1
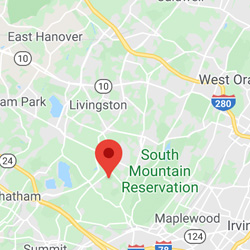
Short Hills
Fit Score: 85.81
 13,092
1,000
260
10
290
3.47
150
12
21
Yes
150
12
13,092
1,000
260
10
290
3.47
150
12
21
Yes
150
12
Short Hills, NJ
2
Upper Saddl.
Fit Score: 85.36
8,270
990
210
10
230
3.47
130
9
13
Yes
160
10
Upper Saddle River, NJ
3
Glen Rock
Fit Score: 84.83
11,829
990
210
10
230
3.47
130
9
13
Yes
160
10
Glen Rock, NJ
4
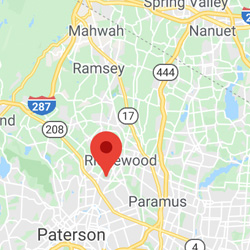
Ridgewood
Fit Score: 84.82
25,272
990
210
10
230
3.47
130
9
13
Yes
160
10
Ridgewood, NJ
5
Woodcliff L.
Fit Score: 84.79
5,862
990
210
10
230
3.47
130
9
13
Yes
160
10
Woodcliff Lake, NJ
6
Franklin La.
Fit Score: 84.57
11,096
990
210
10
230
3.47
130
9
13
Yes
160
10
Franklin Lakes, NJ
7
Tenafly
Fit Score: 84.52
14,641
990
210
10
230
3.47
130
9
13
Yes
160
10
Tenafly, NJ
8
Allendale
Fit Score: 84.44
6,792
990
210
10
230
3.47
130
9
13
Yes
160
10
Allendale, NJ
9
Wyckoff
Fit Score: 84.28
17,068
990
210
10
230
3.47
130
9
13
Yes
160
10
Wyckoff, NJ
10
Millburn
Fit Score: 84.06
20,171
1,000
260
10
290
3.47
150
12
21
Yes
150
12
Millburn, NJ
11
Old Tappan
Fit Score: 84.04
5,946
990
210
10
230
3.47
130
9
13
Yes
160
10
Old Tappan, NJ
12
Montgomery
Fit Score: 84
23,269
960
170
30
240
3.47
110
8
11
No
180
9
Montgomery, NJ
13
River Vale
Fit Score: 83.96
10,062
990
210
10
230
3.47
130
9
13
Yes
160
10
River Vale, NJ
14
Ramsey
Fit Score: 83.92
14,991
990
210
10
230
3.47
130
9
13
Yes
160
10
Ramsey, NJ
15
Oradell
Fit Score: 83.91
8,193
990
210
10
230
3.47
130
9
13
Yes
160
10
Oradell, NJ
16
Westfield
Fit Score: 83.88
29,881
990
220
10
250
3.64
130
11
17
No
160
11
Westfield, NJ
17
Cresskill
Fit Score: 83.86
8,775
990
210
10
230
3.47
130
9
13
Yes
160
10
Cresskill, NJ
18
Glen Ridge
Fit Score: 83.84
7,598
1,000
260
10
290
3.47
150
12
21
Yes
150
12
Glen Ridge, NJ
19
Upper Montc.
Fit Score: 83.82
11,696
1,000
260
10
290
3.47
150
12
21
Yes
150
12
Upper Montclair, NJ
20
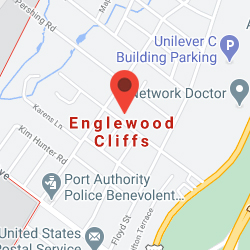
Englewood C.
Fit Score: 83.8
5,385
990
210
10
230
3.47
130
9
13
Yes
160
10
Englewood Cliffs, NJ
21
Closter
Fit Score: 83.65
8,582
990
210
10
230
3.47
130
9
13
Yes
160
10
Closter, NJ
22
Washington
Fit Score: 83.58
9,246
990
210
10
230
3.47
130
9
13
Yes
160
10
Washington, NJ
23
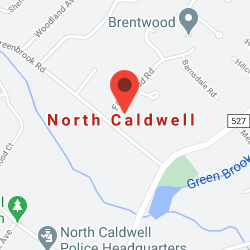
North Caldw.
Fit Score: 83.49
6,618
1,000
260
10
290
3.47
150
12
21
Yes
150
12
North Caldwell, NJ
24
Norwood
Fit Score: 83.46
5,831
990
210
10
230
3.47
130
9
13
Yes
160
10
Norwood, NJ
25
Hillsdale
Fit Score: 83.44
10,405
990
210
10
230
3.47
130
9
13
Yes
160
10
Hillsdale, NJ
26
Berkeley He.
Fit Score: 83.42
13,601
990
220
10
250
3.64
130
11
17
No
160
11
Berkeley Heights, NJ
27
River Edge
Fit Score: 83.39
11,531
990
210
10
230
3.47
130
9
13
Yes
160
10
River Edge, NJ
28
Montvale
Fit Score: 83.26
8,600
990
210
10
230
3.47
130
9
13
Yes
160
10
Montvale, NJ
29
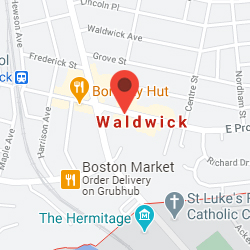
Waldwick
Fit Score: 83.09
10,207
990
210
10
230
3.47
130
9
13
Yes
160
10
Waldwick, NJ
30
Warren
Fit Score: 83.04
15,745
960
170
30
240
3.47
110
8
11
No
180
9
Warren, NJ
31
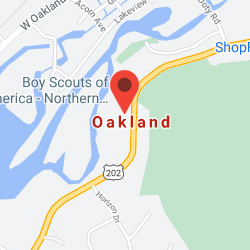
Oakland
Fit Score: 82.99
13,021
990
210
10
230
3.47
130
9
13
Yes
160
10
Oakland, NJ
32
Emerson
Fit Score: 82.94
7,643
990
210
10
230
3.47
130
9
13
Yes
160
10
Emerson, NJ
33
Bernardsvil.
Fit Score: 82.89
7,686
960
170
30
240
3.47
110
8
11
No
180
9
Bernardsville, NJ
34
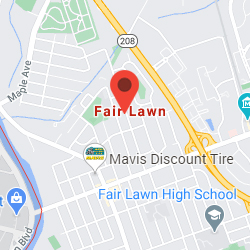
Fair Lawn
Fit Score: 82.88
33,128
990
210
10
230
3.47
130
9
13
Yes
160
10
Fair Lawn, NJ
35
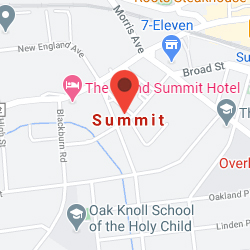
Summit
Fit Score: 82.86
22,016
990
220
10
250
3.64
130
11
17
No
160
11
Summit, NJ
36
Fanwood
Fit Score: 82.85
7,704
990
220
10
250
3.64
130
11
17
No
160
11
Fanwood, NJ
37
Mahwah
Fit Score: 82.78
26,380
990
210
10
230
3.47
130
9
13
Yes
160
10
Mahwah, NJ
38
Park Ridge
Fit Score: 82.77
8,786
990
210
10
230
3.47
130
9
13
Yes
160
10
Park Ridge, NJ
39
Teaneck
Fit Score: 82.75
40,619
990
210
10
230
3.47
130
9
13
Yes
160
10
Teaneck, NJ
40
Mountainsid.
Fit Score: 82.75
6,892
990
220
10
250
3.64
130
11
17
No
160
11
Mountainside, NJ
41
New Provide.
Fit Score: 82.75
13,486
990
220
10
250
3.64
130
11
17
No
160
11
New Providence, NJ
42
Midland Par.
Fit Score: 82.71
7,265
990
210
10
230
3.47
130
9
13
Yes
160
10
Midland Park, NJ
43
Paramus
Fit Score: 82.7
26,558
990
210
10
230
3.47
130
9
13
Yes
160
10
Paramus, NJ
44
Edgewater
Fit Score: 82.64
12,720
990
210
10
230
3.47
130
9
13
Yes
160
10
Edgewater, NJ
45
Wood-Ridge
Fit Score: 82.6
9,159
990
210
10
230
3.47
130
9
13
Yes
160
10
Wood-Ridge, NJ
46
Cranford
Fit Score: 82.5
24,169
990
220
10
250
3.64
130
11
17
No
160
11
Cranford, NJ
47
Bernards
Fit Score: 82.41
27,205
960
170
30
240
3.47
110
8
11
No
180
9
Bernards, NJ
48
Green Brook
Fit Score: 82.35
7,090
960
170
30
240
3.47
110
8
11
No
180
9
Green Brook, NJ
49
Westwood
Fit Score: 82.35
11,155
990
210
10
230
3.47
130
9
13
Yes
160
10
Westwood, NJ
50
Martinsvill.
Fit Score: 82.33
11,707
960
170
30
240
3.47
110
8
11
No
180
9