

1
Scarsdale
Fit Score: 85.53
 17,863
1,000
210
10
210
3.64
110
10
3.2
Yes
190
10
17,863
1,000
210
10
210
3.64
110
10
3.2
Yes
190
10
Scarsdale, NY
2
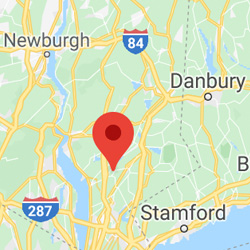
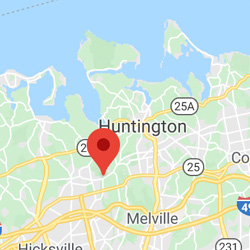
East Hills
Fit Score: 85.22
7,189
990
230
0
230
3.5
110
9
3.1
Yes
180
10
East Hills, NY
3
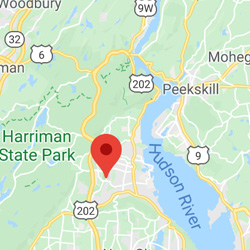
Blauvelt
Fit Score: 84.17
5,794
950
250
30
240
3.4
120
11
3.5
Yes
160
11
Blauvelt, NY
4
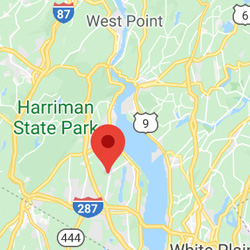
Greenville
Fit Score: 84.12
7,087
1,000
210
10
210
3.64
110
10
3.2
Yes
190
10
Greenville, NY
5
New City
Fit Score: 84.11
34,338
950
250
30
240
3.4
120
11
3.5
Yes
160
11
New City, NY
6
New Castle
Fit Score: 84.08
17,862
1,000
210
10
210
3.64
110
10
3.2
Yes
190
10
New Castle, NY
7
Thiells
Fit Score: 84.03
5,511
950
250
30
240
3.4
120
11
3.5
Yes
160
11
Thiells, NY
8
Woodbury
Fit Score: 84.01
8,684
990
230
0
230
3.5
110
9
3.1
Yes
180
10
Woodbury, NY
9
Bronxville
Fit Score: 83.88
6,440
1,000
210
10
210
3.64
110
10
3.2
Yes
190
10
Bronxville, NY
10
Garden City
Fit Score: 83.81
22,495
990
230
0
230
3.5
110
9
3.1
Yes
180
10
Garden City, NY
11
Wesley Hill.
Fit Score: 83.75
5,882
950
250
30
240
3.4
120
11
3.5
Yes
160
11
Wesley Hills, NY
12
New Hempste.
Fit Score: 83.71
5,415
950
250
30
240
3.4
120
11
3.5
Yes
160
11
New Hempstead, NY
13
Congers
Fit Score: 83.68
8,389
950
250
30
240
3.4
120
11
3.5
Yes
160
11
Congers, NY
14
Tappan
Fit Score: 83.64
7,049
950
250
30
240
3.4
120
11
3.5
Yes
160
11
Tappan, NY
15
Larchmont
Fit Score: 83.62
6,069
1,000
210
10
210
3.64
110
10
3.2
Yes
190
10
Larchmont, NY
16
Jericho
Fit Score: 83.62
14,014
990
230
0
230
3.5
110
9
3.1
Yes
180
10
Jericho, NY
17
Pound Ridge
Fit Score: 83.61
5,153
1,000
210
10
210
3.64
110
10
3.2
Yes
190
10
Pound Ridge, NY
18
Syosset
Fit Score: 83.61
19,669
990
230
0
230
3.5
110
9
3.1
Yes
180
10
Syosset, NY
19
Clarkstown
Fit Score: 83.6
86,329
950
250
30
240
3.4
120
11
3.5
Yes
160
11
Clarkstown, NY
20
Pearl River
Fit Score: 83.41
16,116
950
250
30
240
3.4
120
11
3.5
Yes
160
11
Pearl River, NY
21
Valley Cott.
Fit Score: 83.38
10,230
950
250
30
240
3.4
120
11
3.5
Yes
160
11
Valley Cottage, NY
22
Merrick
Fit Score: 83.3
20,679
990
230
0
230
3.5
110
9
3.1
Yes
180
10
Merrick, NY
23
Stony Point
Fit Score: 83.25
15,377
950
250
30
240
3.4
120
11
3.5
Yes
160
11
Stony Point, NY
24
Orangetown
Fit Score: 83.14
50,092
950
250
30
240
3.4
120
11
3.5
Yes
160
11
Orangetown, NY
25

Nanuet
Fit Score: 83.08
18,312
950
250
30
240
3.4
120
11
3.5
Yes
160
11
Nanuet, NY
26
Airmont
Fit Score: 82.99
8,771
950
250
30
240
3.4
120
11
3.5
Yes
160
11
Airmont, NY
27
Chestnut Ri.
Fit Score: 82.98
8,032
950
250
30
240
3.4
120
11
3.5
Yes
160
11
Chestnut Ridge, NY
28
Hillcrest
Fit Score: 82.97
7,697
950
250
30
240
3.4
120
11
3.5
Yes
160
11
Hillcrest, NY
29
North Castl.
Fit Score: 82.96
12,212
1,000
210
10
210
3.64
110
10
3.2
Yes
190
10
North Castle, NY
30
Wantagh
Fit Score: 82.88
18,525
990
230
0
230
3.5
110
9
3.1
Yes
180
10
Wantagh, NY
31
South Valle.
Fit Score: 82.75
6,924
990
230
0
230
3.5
110
9
3.1
Yes
180
10
South Valley Stream, NY
32
Plainview
Fit Score: 82.75
26,141
990
230
0
230
3.5
110
9
3.1
Yes
180
10
Plainview, NY
33
Woodmere
Fit Score: 82.75
17,376
990
230
0
230
3.5
110
9
3.1
Yes
180
10
Woodmere, NY
34
Suffern
Fit Score: 82.72
11,027
950
250
30
240
3.4
120
11
3.5
Yes
160
11
Suffern, NY
35
Manhasset
Fit Score: 82.67
7,922
990
230
0
230
3.5
110
9
3.1
Yes
180
10
Manhasset, NY
36
Rye
Fit Score: 82.64
15,752
1,000
210
10
210
3.64
110
10
3.2
Yes
190
10
Rye, NY
37
Lawrence
Fit Score: 82.64
6,559
990
230
0
230
3.5
110
9
3.1
Yes
180
10
Lawrence, NY
38
North Bellm.
Fit Score: 82.58
19,994
990
230
0
230
3.5
110
9
3.1
Yes
180
10
North Bellmore, NY
39
Bellmore
Fit Score: 82.49
15,767
990
230
0
230
3.5
110
9
3.1
Yes
180
10
Bellmore, NY
40
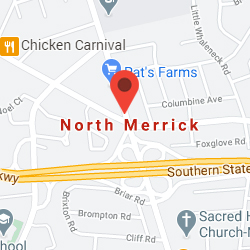
North Merri.
Fit Score: 82.46
12,436
990
230
0
230
3.5
110
9
3.1
Yes
180
10
North Merrick, NY
41
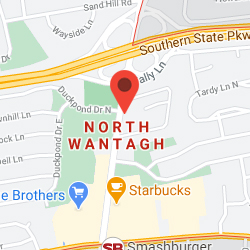
North Wanta.
Fit Score: 82.43
12,019
990
230
0
230
3.5
110
9
3.1
Yes
180
10
North Wantagh, NY
42
Massapequa
Fit Score: 82.41
22,102
990
230
0
230
3.5
110
9
3.1
Yes
180
10
Massapequa, NY
43
Massapequa .
Fit Score: 82.4
17,091
990
230
0
230
3.5
110
9
3.1
Yes
180
10
Massapequa Park, NY
44
Seaford
Fit Score: 82.4
15,405
990
230
0
230
3.5
110
9
3.1
Yes
180
10
Seaford, NY
45
Kings Point
Fit Score: 82.36
5,287
990
230
0
230
3.5
110
9
3.1
Yes
180
10
Kings Point, NY
46
North Hills
Fit Score: 82.32
5,987
990
230
0
230
3.5
110
9
3.1
Yes
180
10
North Hills, NY
47
Oyster Bay
Fit Score: 82.31
298,388
990
230
0
230
3.5
110
9
3.1
Yes
180
10
Oyster Bay, NY
48
Port Washin.
Fit Score: 82.29
16,034
990
230
0
230
3.5
110
9
3.1
Yes
180
10
Port Washington, NY
49
North New H.
Fit Score: 82.26
15,585
990
230
0
230
3.5
110
9
3.1
Yes
180
10
North New Hyde Park, NY
50
Plainedge
Fit Score: 82.24
9,227
990
230
0
230
3.5
110
9
3.1
Yes
180
10