

1
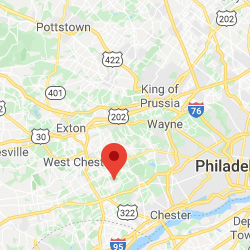
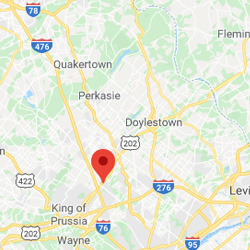
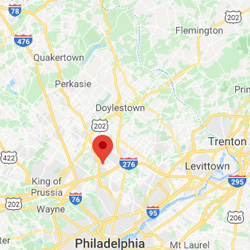
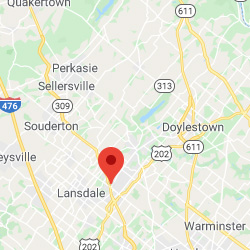
Thornbury
Fit Score: 80.6
 7,707
960
200
20
260
4.17
150
11
3.7
No
190
12
7,707
960
200
20
260
4.17
150
11
3.7
No
190
12
Thornbury, PA
2
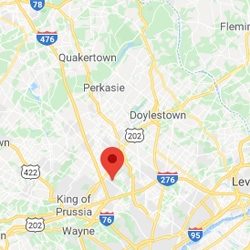
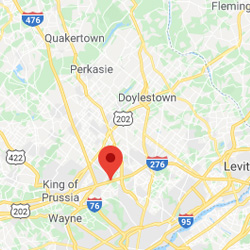
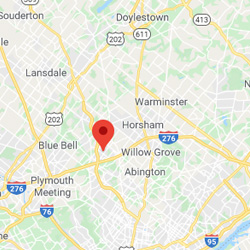
Blue Bell
Fit Score: 80.48
6,290
960
170
40
260
3.22
130
9
3.1
Yes
190
10
Blue Bell, PA
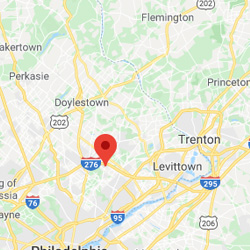
3
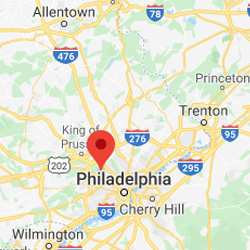
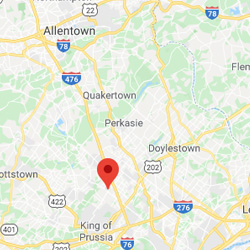
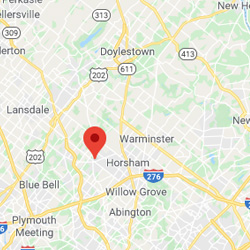
Lower Merio.
Fit Score: 80.42
59,578
960
170
40
260
3.22
130
9
3.1
Yes
190
10
Lower Merion, PA
4
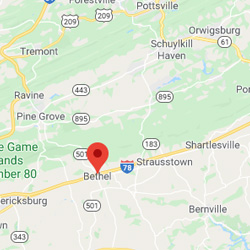
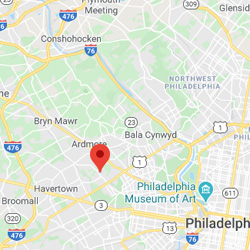
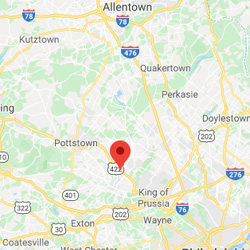
Bethel
Fit Score: 80.29
9,199
960
200
20
260
4.17
150
11
3.7
No
190
12
Bethel, PA
5
Whitpain
Fit Score: 80.25
19,248
960
170
40
260
3.22
130
9
3.1
Yes
190
10
Whitpain, PA
6
Whitemarsh
Fit Score: 80.05
18,120
960
170
40
260
3.22
130
9
3.1
Yes
190
10
Whitemarsh, PA
7
Worcester
Fit Score: 80.02
10,442
960
170
40
260
3.22
130
9
3.1
Yes
190
10
Worcester, PA
8
Penn Wynne
Fit Score: 79.99
5,720
960
170
40
260
3.22
130
9
3.1
Yes
190
10
Penn Wynne, PA
9
Upper Dubli.
Fit Score: 79.96
26,511
960
170
40
260
3.22
130
9
3.1
Yes
190
10
Upper Dublin, PA
10
Fort Washin.
Fit Score: 79.89
5,640
960
170
40
260
3.22
130
9
3.1
Yes
190
10
Fort Washington, PA
11
Maple Glen
Fit Score: 79.87
6,764
960
170
40
260
3.22
130
9
3.1
Yes
190
10
Maple Glen, PA
12
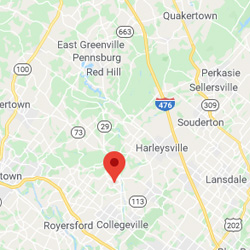
Upper Provi.
Fit Score: 79.79
10,403
960
200
20
260
4.17
150
11
3.7
No
190
12
Upper Providence, PA
13
Montgomeryv.
Fit Score: 79.79
13,370
960
170
40
260
3.22
130
9
3.1
Yes
190
10
Montgomeryville, PA
14
Perkiomen
Fit Score: 79.63
9,175
960
170
40
260
3.22
130
9
3.1
Yes
190
10
Perkiomen, PA
15
Lower Morel.
Fit Score: 79.57
13,146
960
170
40
260
3.22
130
9
3.1
Yes
190
10
Lower Moreland, PA
16
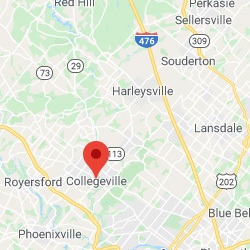
Collegevill.
Fit Score: 79.55
5,113
960
170
40
260
3.22
130
9
3.1
Yes
190
10
Collegeville, PA
17
Radnor
Fit Score: 79.54
31,770
960
200
20
260
4.17
150
11
3.7
No
190
12
Radnor, PA
18
Lower Salfo.
Fit Score: 79.51
15,470
960
170
40
260
3.22
130
9
3.1
Yes
190
10
Lower Salford, PA
19
Nether Prov.
Fit Score: 79.39
13,743
960
200
20
260
4.17
150
11
3.7
No
190
12
Nether Providence, PA
20
Swarthmore
Fit Score: 79.36
6,401
960
200
20
260
4.17
150
11
3.7
No
190
12
Swarthmore, PA
21
Trooper
Fit Score: 79.29
5,732
960
170
40
260
3.22
130
9
3.1
Yes
190
10
Trooper, PA
22
Lower Gwyne.
Fit Score: 79.25
11,520
960
170
40
260
3.22
130
9
3.1
Yes
190
10
Lower Gwynedd, PA
23
Haverford
Fit Score: 79.21
49,275
960
200
20
260
4.17
150
11
3.7
No
190
12
Haverford, PA
24
Lower Provi.
Fit Score: 79.16
26,812
960
170
40
260
3.22
130
9
3.1
Yes
190
10
Lower Providence, PA
25
Oreland
Fit Score: 79.16
5,889
960
170
40
260
3.22
130
9
3.1
Yes
190
10
Oreland, PA
26
Plymouth Me.
Fit Score: 79.15
6,261
960
170
40
260
3.22
130
9
3.1
Yes
190
10
Plymouth Meeting, PA
27
Upper Potts.
Fit Score: 79.13
5,739
960
170
40
260
3.22
130
9
3.1
Yes
190
10
Upper Pottsgrove, PA
28
Upper Merio.
Fit Score: 79.09
31,056
960
170
40
260
3.22
130
9
3.1
Yes
190
10
Upper Merion, PA
29
Franconia
Fit Score: 79.04
13,325
960
170
40
260
3.22
130
9
3.1
Yes
190
10
Franconia, PA
30
Upper Gwyne.
Fit Score: 79.02
15,849
960
170
40
260
3.22
130
9
3.1
Yes
190
10
Upper Gwynedd, PA
31
New Hanover
Fit Score: 79.02
13,035
960
170
40
260
3.22
130
9
3.1
Yes
190
10
New Hanover, PA
32
Concord
Fit Score: 78.98
17,853
960
200
20
260
4.17
150
11
3.7
No
190
12
Concord, PA
33
Harleysvill.
Fit Score: 78.95
9,673
960
170
40
260
3.22
130
9
3.1
Yes
190
10
Harleysville, PA
34
Limerick
Fit Score: 78.91
19,056
960
170
40
260
3.22
130
9
3.1
Yes
190
10
Limerick, PA
35
Wyndmoor
Fit Score: 78.9
5,911
960
170
40
260
3.22
130
9
3.1
Yes
190
10
Wyndmoor, PA
36
Audubon
Fit Score: 78.88
9,010
960
170
40
260
3.22
130
9
3.1
Yes
190
10
Audubon, PA
37
Glenside
Fit Score: 78.87
7,684
960
170
40
260
3.22
130
9
3.1
Yes
190
10
Glenside, PA
38
King Of Pru.
Fit Score: 78.85
20,044
960
170
40
260
3.22
130
9
3.1
Yes
190
10
King Of Prussia, PA
39
Abington
Fit Score: 78.84
55,468
960
170
40
260
3.22
130
9
3.1
Yes
190
10
Abington, PA
40
Upper Hanov.
Fit Score: 78.82
7,857
960
170
40
260
3.22
130
9
3.1
Yes
190
10
Upper Hanover, PA
41
Douglass
Fit Score: 78.81
10,589
960
170
40
260
3.22
130
9
3.1
Yes
190
10
Douglass, PA
42
Horsham
Fit Score: 78.75
14,563
960
170
40
260
3.22
130
9
3.1
Yes
190
10
Horsham, PA
43
Conshohocke.
Fit Score: 78.73
8,065
960
170
40
260
3.22
130
9
3.1
Yes
190
10
Conshohocken, PA
44
Marple
Fit Score: 78.72
23,810
960
200
20
260
4.17
150
11
3.7
No
190
12
Marple, PA
45
Newtown
Fit Score: 78.71
13,726
960
200
20
260
4.17
150
11
3.7
No
190
12
Newtown, PA
46
Towamencin
Fit Score: 78.69
18,491
960
170
40
260
3.22
130
9
3.1
Yes
190
10
Towamencin, PA
47
Folsom
Fit Score: 78.65
8,577
960
200
20
260
4.17
150
11
3.7
No
190
12
Folsom, PA
48
Ardmore
Fit Score: 78.65
13,193
960
200
20
260
4.17
150
11
3.7
No
190
12
Ardmore, PA
49
Cheltenham
Fit Score: 78.61
37,219
960
170
40
260
3.22
130
9
3.1
Yes
190
10
Cheltenham, PA
50
East Norrit.
Fit Score: 78.6
14,014
960
170
40
260
3.22
130
9
3.1
Yes
190
10